Reports
Disbursals Report
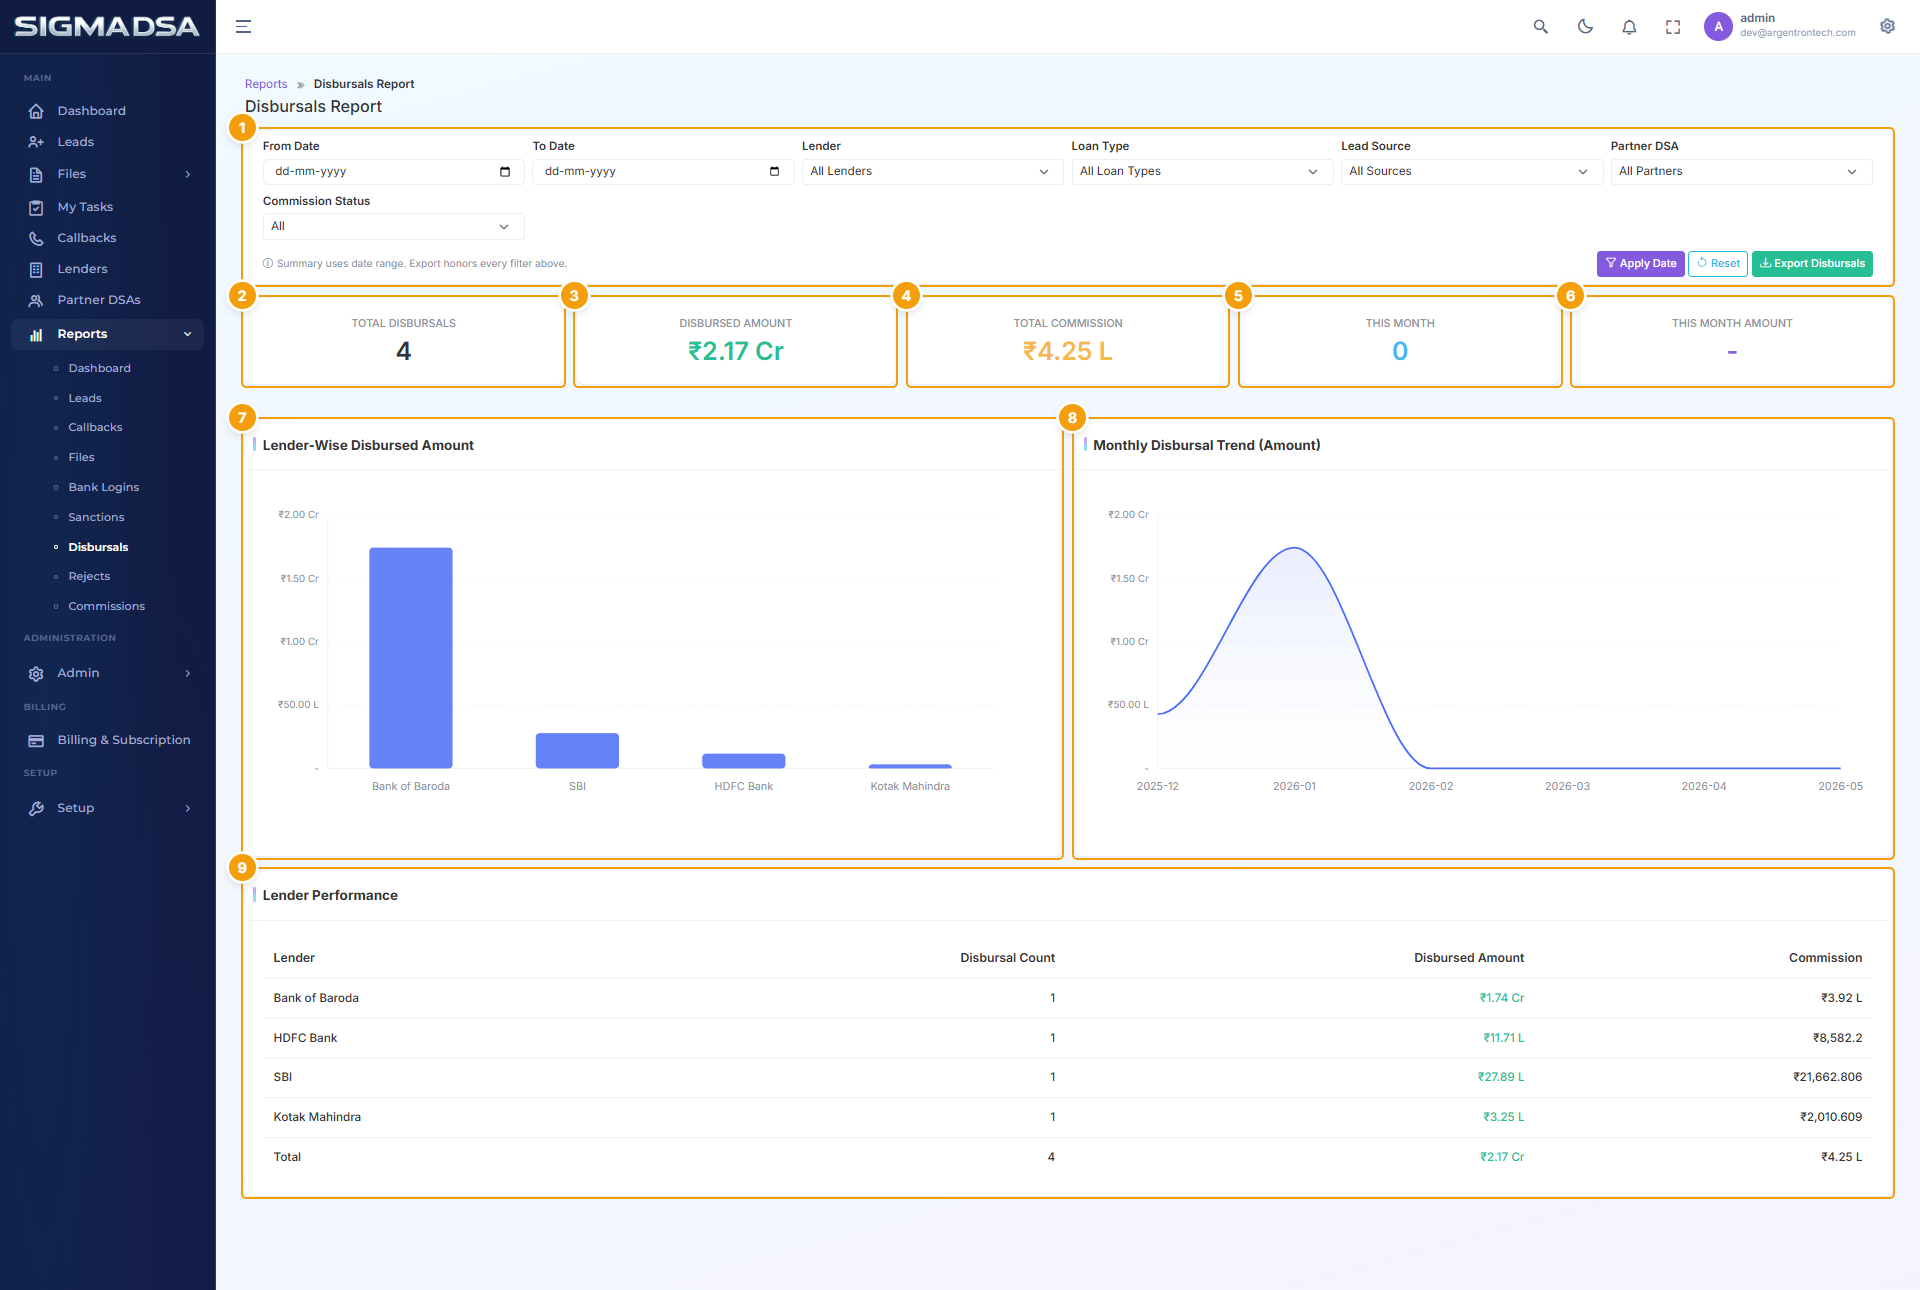
Disbursement trends and amounts — monthly disbursed volume, per-lender + per-product split, top performers, multi-tranche tracking.
The Disbursals Report is your revenue-driver — only disbursed loans earn commission, so this is the single most important volume metric.
What's on the report
- KPI cards — disbursed ₹ total, disbursed this month, count this month, average disbursal size.
- Monthly trend — disbursed ₹ per month.
- Per-lender split — disbursed ₹ + count + commission per lender.
- Per-product split — Home Loan vs Personal vs Business etc.
- Top owners — disbursed-by-owner ranking.
- Multi-tranche files — files with > 1 disbursal row (construction-linked Home Loans, working-capital limits).
- Disbursal table — full detail with date, lender, file, amount, commission, UTR.
Common flows
- Monthly revenue close — Monthly Trend chart for the management report. Sum-of-commission for accountant.
- Underperforming product — per-product split shows which loan types are flat; drives product strategy (push it harder or de-prioritise).
- Owner recognition — top-owners chart → bonus / leaderboard inputs.