Reports
Sanctions Report
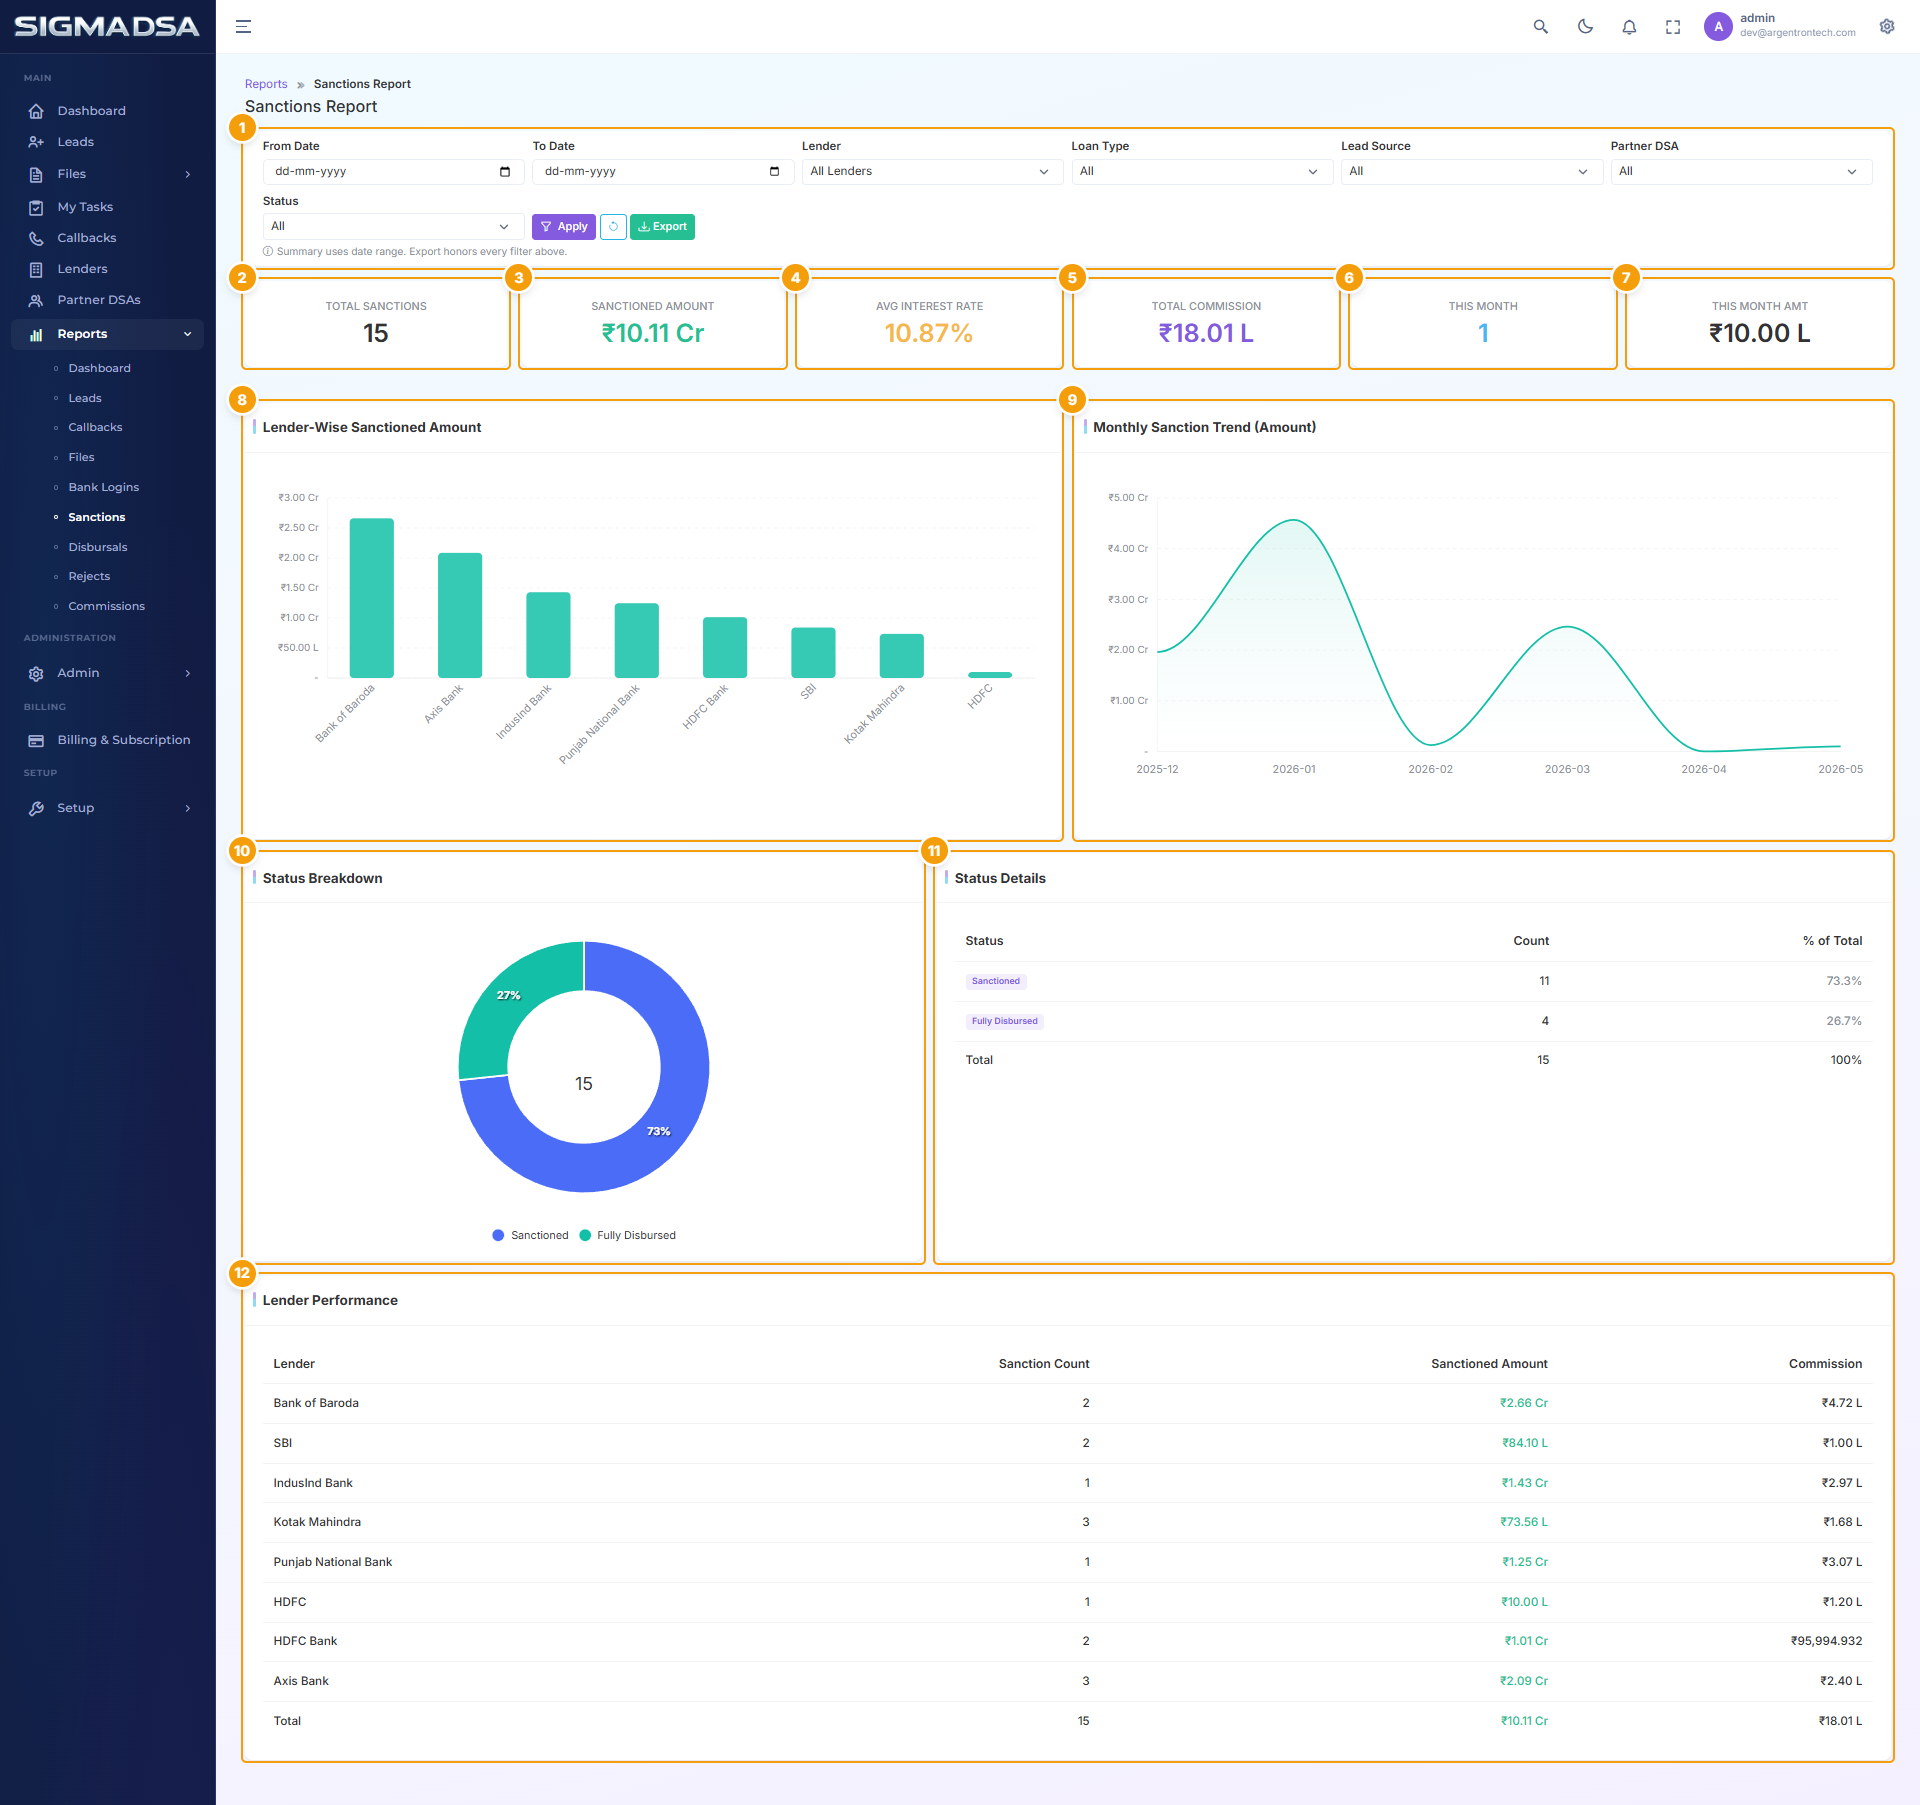
Approved sanctions and amounts — sanctioned volume per lender, average sanctioned-to-requested ratio, ROI/tenure distribution, and time-from-login.
The Sanctions Report measures the approval engine — how many sanctions land per month, from which lenders, at what amounts and rates, and how long they took from initial login to letter received.
What's on the report
- KPI cards — total sanctioned ₹, sanctions this month, average sanctioned amount, sanction-to-login ratio.
- Monthly trend — sanctioned ₹ per month over last 6/12 months.
- Per-lender split — sanctioned ₹ + count per lender.
- ROI distribution — histogram showing the rate band most sanctions land in.
- Tenure distribution — histogram of approved tenures.
- Time from login to sanction — average days, broken down by lender.
- Sanction table — exportable, per-file detail.
Common flows
- Lender competitiveness — compare per-lender average ROI → use to push customers to better-rate lenders.
- Sanctioned-to-requested ratio — if banks consistently haircut > 15%, your applicants may be over-asking; adjust the qualifying conversation.
- Quarterly business review — month-over-month sanctioned trend feeds the management deck.
Next steps
Login Files Report
Files logged in with lenders — submission volume per lender, query-response time, average time from login to sanction, and stuck-login detection.
Disbursals Report
Disbursement trends and amounts — monthly disbursed volume, per-lender + per-product split, top performers, multi-tranche tracking.